As we look ahead to the 2023-2024 winter season, it’s important to remember that any winter outlook will contain an inherent degree of uncertainty. However, there are a few clues that we can keep an eye on.
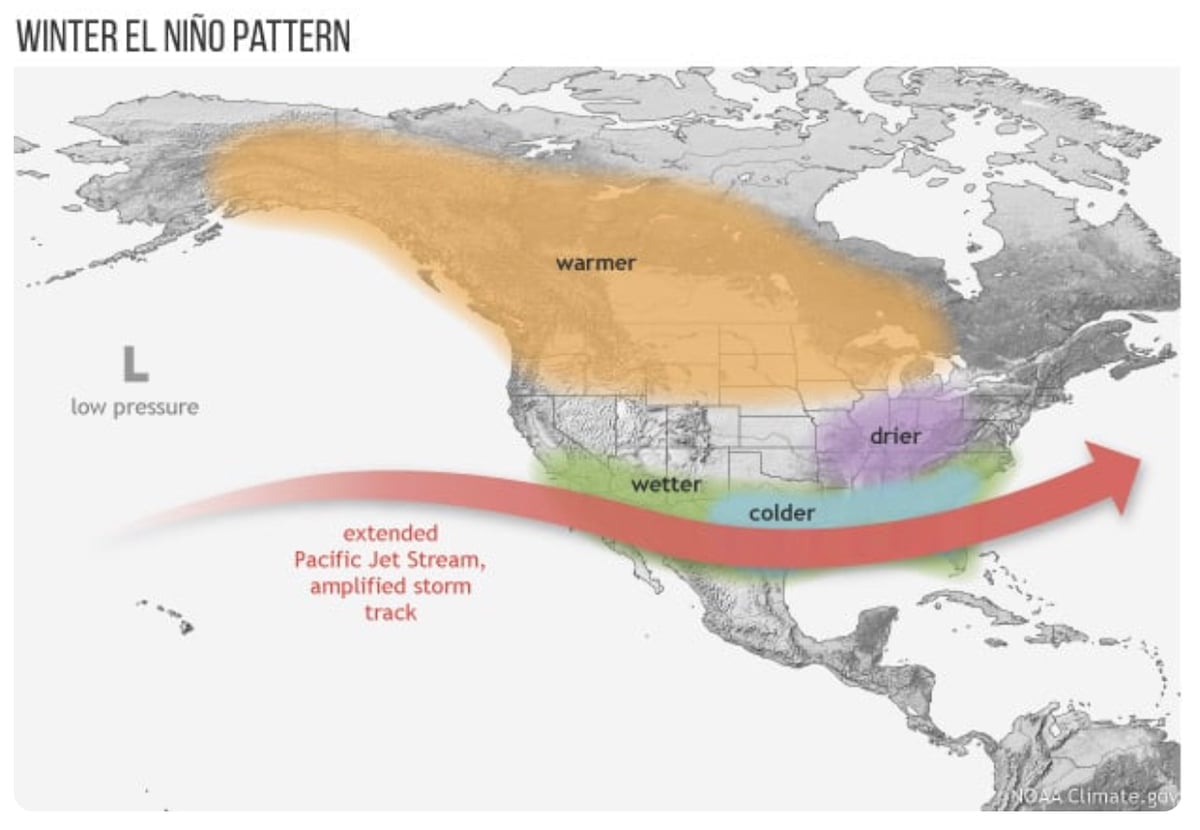
Following three straight winters of La Niña, we are now heading into an El Niño this season.
In fact, current sea surface temperatures as of late August are showing a strengthening El Niño event.
El Niño, Explained
The term El Niño refers to the large-scale ocean-atmosphere climate phenomenon linked to periodic warming in sea-surface temperatures across the central and east-central equatorial Pacific.
El Niño represents the warm phase of the ENSO cycle and means that the ocean water temperatures are warmer than average.
Winter temperatures tend to be warmer than average across Western and Central Canada during El Niño cycles, but precipitation and snowfall signals vary by region.

Confidence is increasing that we could see a strong El Niño this season, which would officially occur if sea surface temperatures in the Niño-3.4 region of the equatorial Pacific Ocean are at least 1.5ºC warmer than average for three consecutive, overlapping 3-month periods.
We have identified 10 significant (moderate-strong) El Niño episodes that have occurred since the official precipitation and snowfall records began at the Central Sierra Snow Lab located just NNW (less than 10 miles) of the ski resort at an elevation of 6,894′.
Let’s take a look at these significant El Niño seasons to see if we can identify any snow trends for the Sierra NW of Lake Tahoe near Palisades Tahoe.
Historical El Niño Seasons @ Palisades Tahoe
After looking back at the 10 significant El Niño years and comparing them against the 50-year median precipitation as of May 31 at the Snow Lab, I’ve found that the median precipitation ends up exactly the same for the 10 significant El Nino seasons as the 50-year median with 59.7 inches.
Precipitation Totals as of May 31 During El Niño Seasons
- 1972-1973: 57.6 inches
- 1982-1983: 86.8 inches
- 1986-1987: 33.7 inches
- 1987-1988: 35.4 inches
- 1991-1992: 37.4 inches
- 1994-1995: 104.3 inches
- 1997-1998: 79.1 inches
- 2002-2003: 59.9 inches
- 2009-2010: 59.5 inches
- 2015-2016: 67.2 inches
- 1970-2023: 59.7 inches (50-year median)
5 out of the 10 (50%) of the El Niño seasons produced above-median precipitation near Palisades Tahoe as of May 31.
For Snowfall, after looking back at the 10 significant El Niño years and comparing them against the 50-year median snowfall as of May 31 at the Snow Lab, I’ve found that the median snowfall ends up around 419 inches for the 10 significant El Nino seasons compared to the 50-year median of 372 inches.
Snowfall Totals as of May 31 During El Nino Seasons
- 1972-1973: 438 inches
- 1982-1983: 671 inches
- 1986-1987: 235 inches
- 1987-1988: 229 inches
- 1991-1992: 237 inches
- 1994-1995: 590 inches
- 1997-1998: 529 inches
- 2002-2003: 399 inches
- 2009-2010: 509 inches
- 2015-2016: 367 inches
- 1970-2023: 372 inches (50-year median)
6 out of the 10 (60%) of the El Niño seasons produced above-median snowfall near Palisades Tahoe as of May 31.
For timing, here’s a look at the median snowfall amounts by month for significant El Nino seasons, and the percent of the 50-year median for each month.
- October: 3 inches (56%)
- November: 31 inches (106%)
- December: 89 inches (156%)
- January: 89 inches (132%)
- February: 58 inches (91%)
- March: 54 inches (90%)
- April: 40 inches (140%)
- May: 13 inches (197%)
December – January has the best chance of being above median for snowfall historically, with the snowfall season tending to linger later into the spring than average.
Overall, history tells us that Palisades tends to see above-median snowfall during significant El Niño events.
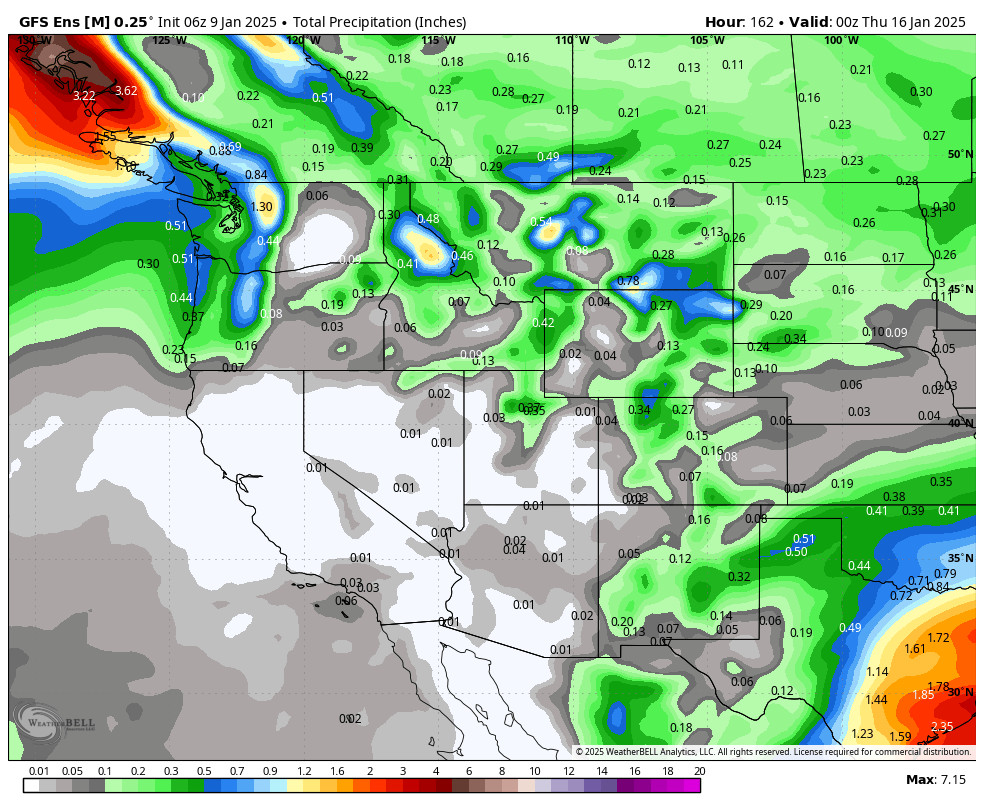
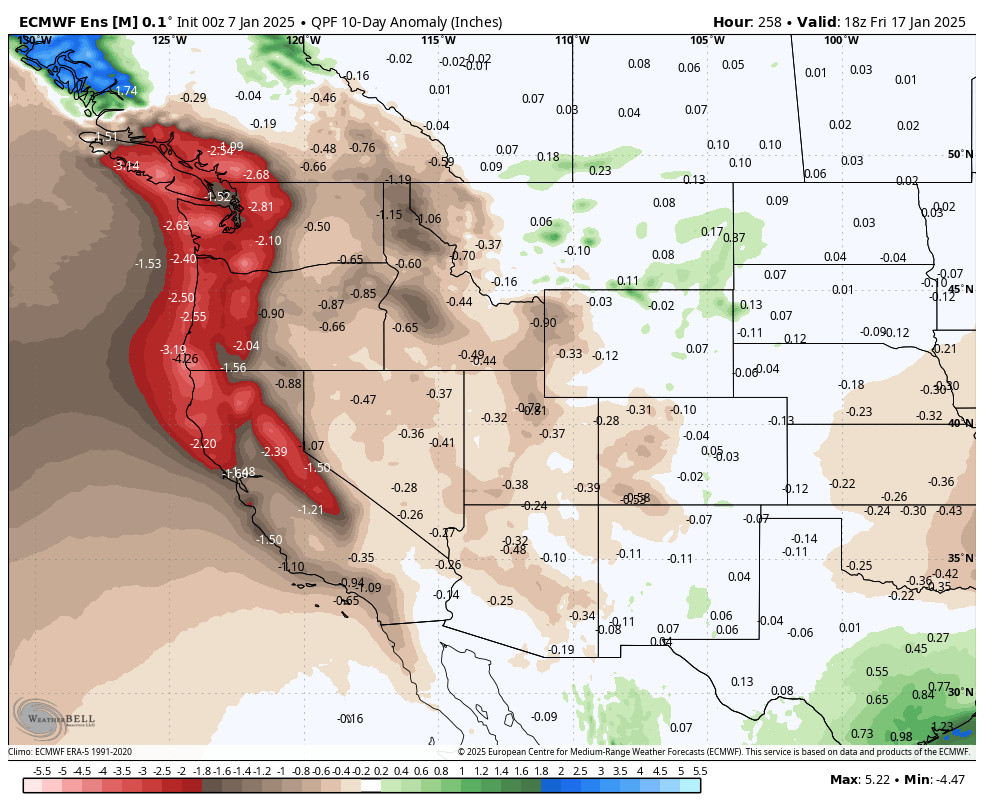
Sometimes, longer-range forecasts can identify possible storms 1-2 weeks (or longer) in advance, but often, forecast confidence in the details of each storm only begins to increase when the system is about one week away or closer.
BA
Book Winter Now

